Python常用的資料視覺化library:
1. matplotlib
import matplotlib.pyplot as plt
折線圖: plt.plot()
plt.plot([-1,2,3.1,4], [1,2,3,4], [1,2,3,4], [2,3,0,1])  ## (x-vals, y-vals, ...)
plt.axis([-2, 5, 0, 5])  ## axis: [xmin, xmax, ymin, ymax]
plt.ylabel("value")
plt.show()
柱狀圖:plt.bar()
names = ['Tom', 'Mary', 'Tim', 'Ken']
math_scores = [80, 85, 66, 90]
eng_scores = [60, 75, 60, 80]
xAxis = np.arange(len(names))+1
plt.bar(xAxis, math_scores, color='lightskyblue', width=0.2, label='math')
plt.bar(xAxis+0.3, eng_scores, color='yellowgreen', width=0.2, label='english')
plt.title('1st Exam', fontsize=14)
plt.xlabel('Students', fontsize=14)
plt.ylabel('Score', fontsize=14)
plt.xticks(xAxis, names)
plt.legend(loc="upper center")
plt.show()
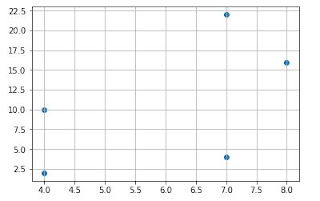
散佈圖:plt.scatter()
speed = [4, 4, 7, 7, 8]
dist = [2, 10, 4, 22, 16]

plt.scatter(speed, dist)
plt.grid(True)
plt.show()
圓餅圖:plt.plot()
labels = ['juice', 'coke', 'milk', 'water']
fracs = [15, 30, 45, 10]

plt.pie(fracs, labels=labels, autopct='%1.1f%%', shadow=True, explode=(0, 0.1, 0, 0))
plt.show()
熱點圖:
left = ["A", "B", "C"]
down = ["1", "2.", "3"]

density = np.array([[0.8, 2.4, 2.5],
                    [2.4, 0.0, 8.0],
                    [1.1, 2.4, 0.8]])

fig, ax = plt.subplots()
im = ax.imshow(density, cmap="YlGn")

ax.set_xticks(np.arange(len(left)))
ax.set_yticks(np.arange(len(down)))
ax.set_xticklabels(left)
ax.set_yticklabels(down)

plt.setp(ax.get_xticklabels(), rotation=45, ha="right",
         rotation_mode="anchor")

for i in range(len(left)):
    for j in range(len(down)):
        text = ax.text(j, i, density[i, j],
                       ha="center", va="center", color="k")
plt.colorbar(im)
ax.set_title("Test")
plt.show()
Histogram:plt.hist()
import matplotlib.mlab as mlab

data = pd.DataFrame([5,5,5,4,4,3,2,6,6,7,8])
bins = np.arange(10)

n, bins, patches = plt.hist(data, bins, normed=1, facecolor='orange', alpha=0.75) ## normed=1:機率;未加此參數會顯示個數
y = mlab.normpdf( bins, data.mean().values, data.std().values)
l = plt.plot(bins, y, 'r--', linewidth=1)

plt.xlabel('Score')
plt.ylabel('Probability')
plt.title(r'$\mathrm{Histogram\ of\ Score:}\ \mu='+ str(data.mean().values) + '\ \sigma=' + str(data.std().values) +'$')

plt.xticks(range(10))
plt.xlim([-1, 10])

plt.grid(True)
plt.grid(color='k', linestyle='--', linewidth=1)

plt.show()


沒有留言:
張貼留言